Graphs: Modeling Many-to-Many Relationships with Cities and Flights
Why We Need Graphs
Some information is naturally tangled together. Think about flights between cities: one city can have direct flights to many other cities, and each of those cities connects to many more. This is a many-to-many relationship — many things linked to many other things.
Simple, straight-line data structures (like a list or an array, where items sit one after another) are not good at storing this kind of tangled web. We need a structure built for it. That structure is a graph.
What Is a Graph?
A graph is a non-linear data structure. "Non-linear" just means the items are not lined up in a single row — they can connect in any direction, like dots joined by lines.
A graph is made of two things:
- Nodes — the items themselves (also called vertices). Think of each node as a dot, for example a city.
- Edges — the links that connect two nodes. Each edge means "these two things are related."
So if City A has a direct flight to City F, we draw a node for A, a node for F, and an edge between them.
Edges Can Carry Weight
An edge can also hold a number called its weight. The weight is extra information about that connection. For flights, a natural weight is the airfare — how much money it costs to fly along that edge. Depending on what the graph models, a weight could mean distance, time, cost, or anything else.
The Travel Booking Example
Imagine raw airline data given as a plain list of connections:
| From | To | Airfare |
|------|------|------|
| City A | City F | 500 |
| City A | City D | 200 |
| City G | City B | 600 |
| City B | City C | 100 |
| City D | City E | 300 |
| City E | City H | 200 |
| City F | City H | 100 |
| City C | City D | 300 |
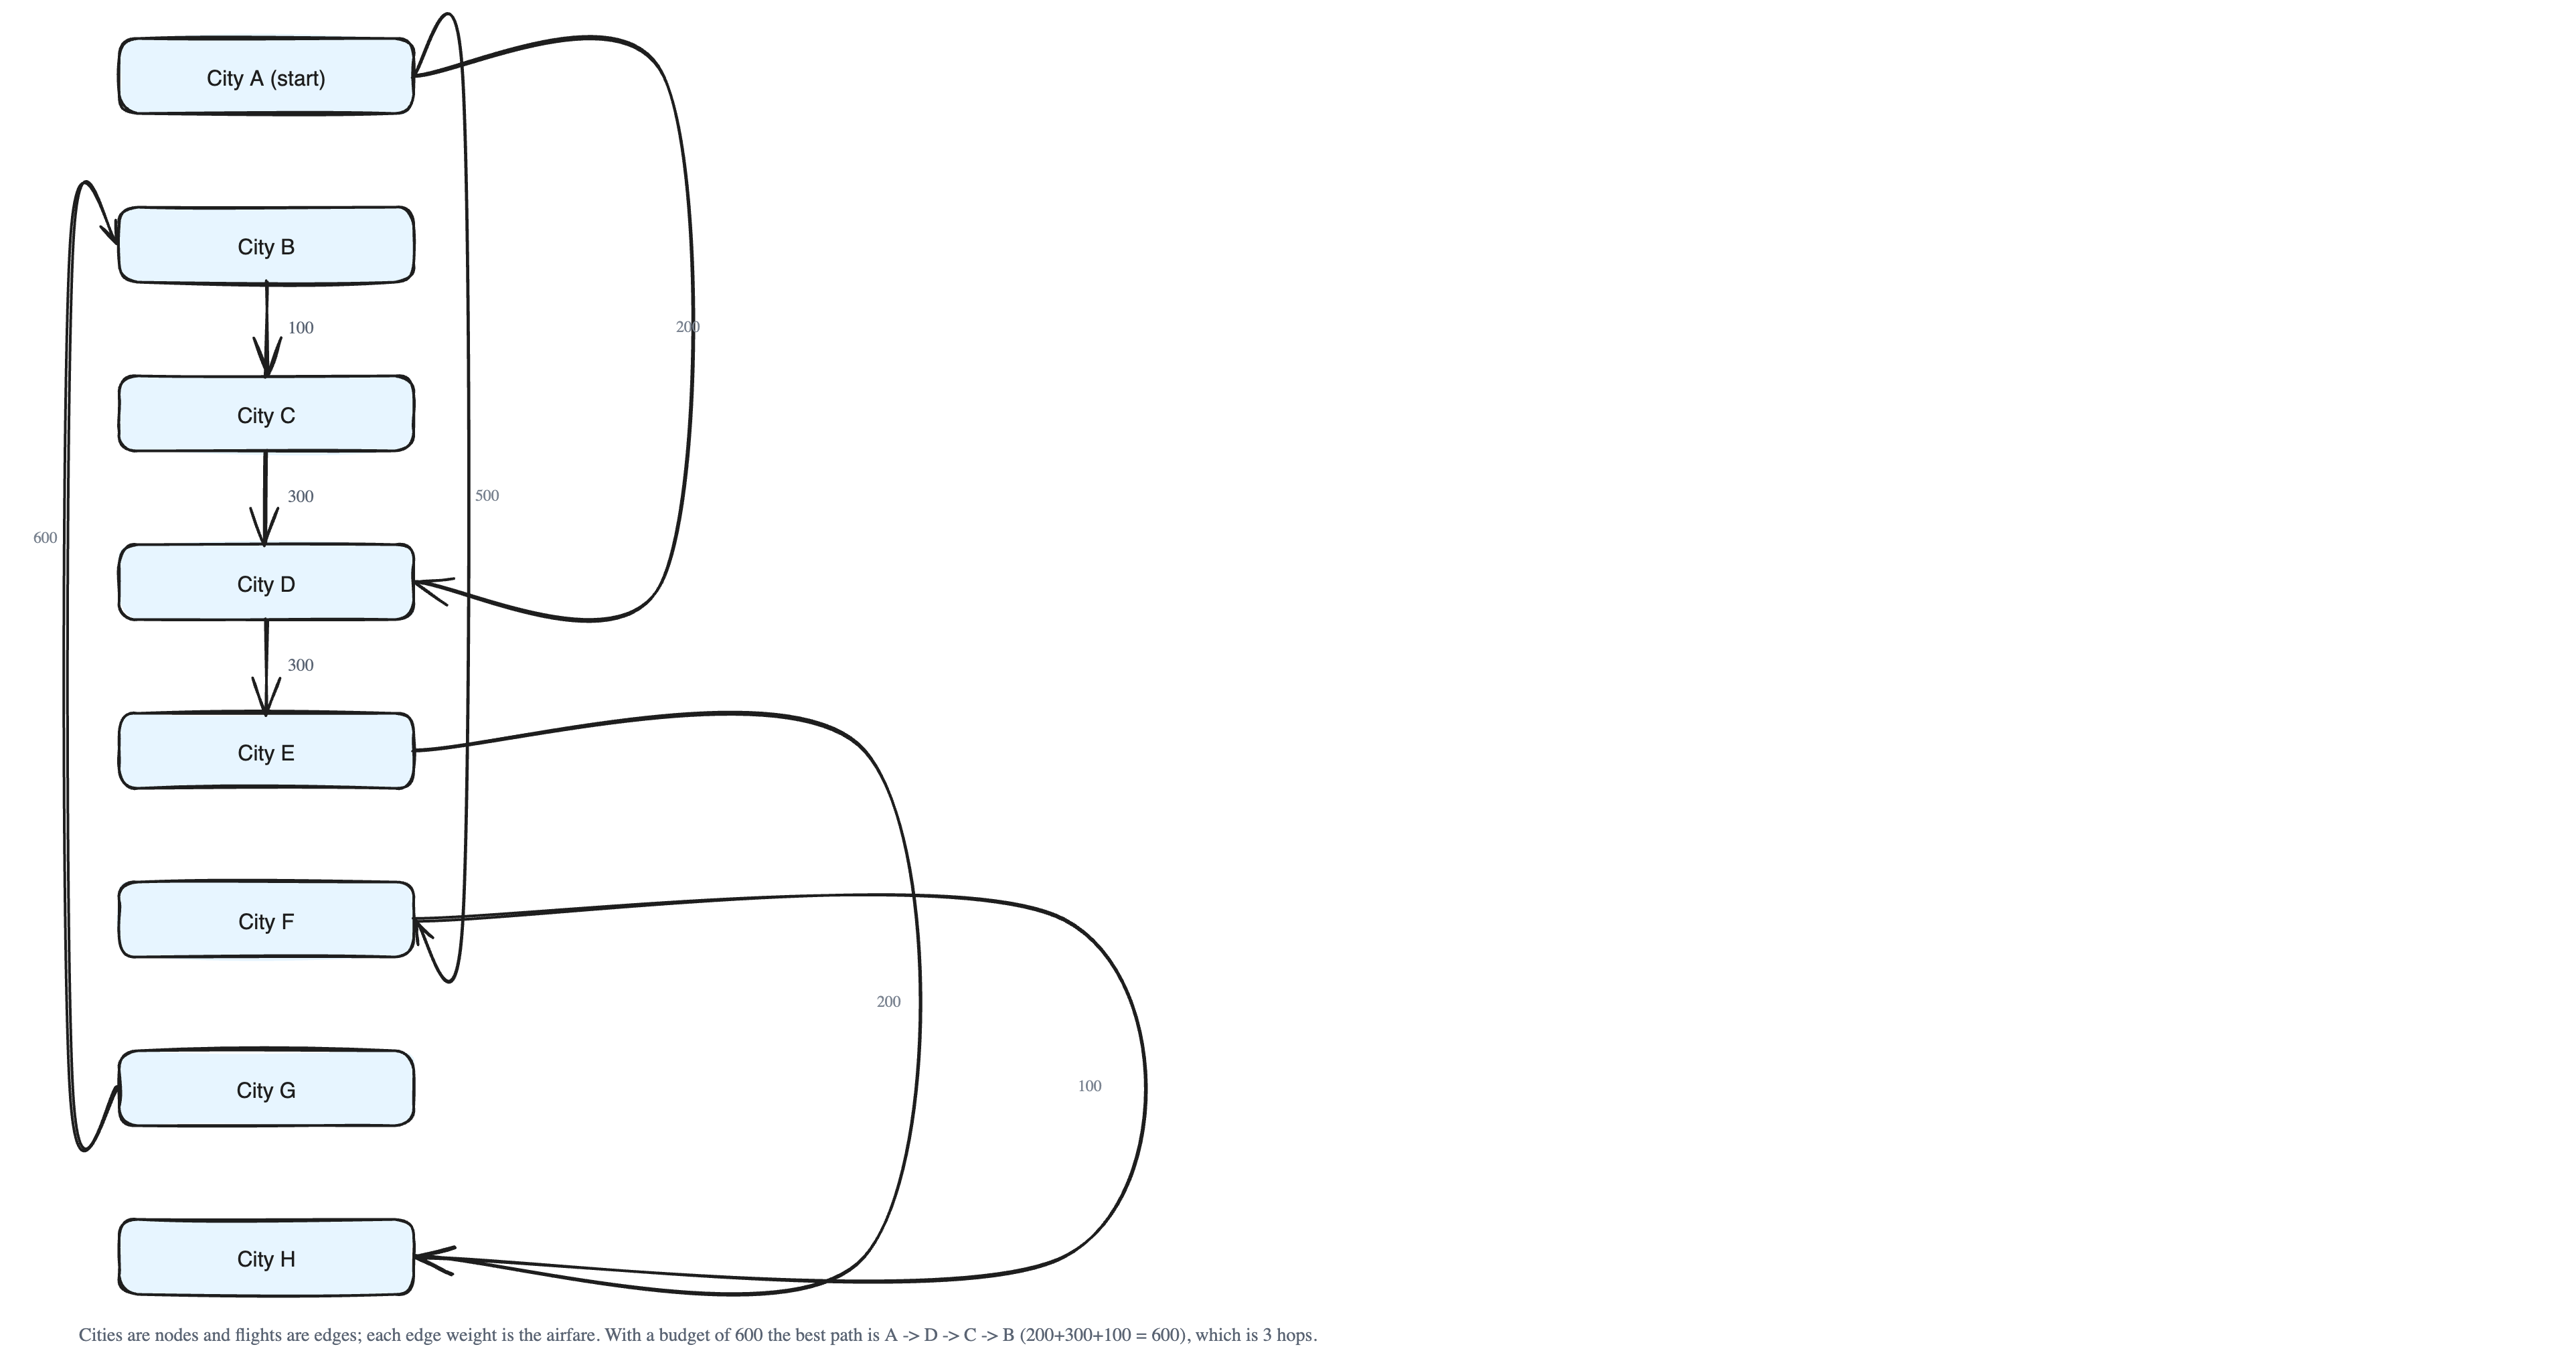
Reading this table, it is hard to *see* how the cities connect. But if we turn it into a graph — each city a node, each flight an edge, each airfare a weight — the whole map becomes clear at a glance.
A graph is also easy to grow. To add a new city, you add one node and connect it with edges to the cities it has direct flights to. No need to reshuffle everything.
Query 1: Minimum Number of Hops
A "hop" is one flight (one edge you travel along). Suppose a user wants the fewest flights from City A to City H.
The intuitive method:
- Start at the source,
City A. - Explore outward step by step. First find every city reachable in 1 hop, then every city reachable in 2 hops, and so on.
- As soon as you reach
City H, stop. Because you grew outward evenly, the first time you touch the destination is automatically the shortest path.
Exploring level by level — 1 hop, then 2 hops, then 3 hops — is exactly the idea behind a famous graph algorithm called Breadth-First Search (BFS).
Query 2: Most Flights for a Fixed Budget
Now a harder, more interesting question: starting at City A with a budget of 600, what is the maximum number of flights the user can take before the money runs out?
Here the edge weights (airfares) matter. The method:
- Start at
City Awith the full budget of 600. - Walk along a path, adding up the airfare of each edge as you go.
- The moment the running total would go over 600, you can go no further on this path — so you back up and try a different path.
- For every path you can afford, record how many hops it used.
- Return the path with the most hops.
Let's trace it. The airfares out of A are A–D = 200 and A–F = 500.
- Going
A → Fcosts 500. FromFthe cheapest next edge isF–H = 100, totaling 600 — that is 2 hops, and the money is now gone. - Going
A → Dcosts 200, leaving 400. ThenD → Ccosts 300 (total 500), leaving 100. ThenC → Bcosts 100 (total exactly 600). That pathA → D → C → Buses 3 hops for exactly 600.
Since 3 hops beats 2 hops, the answer is: for a budget of 600, the user can take a maximum of 3 flights, along the path A → D → C → B.
Walking down a path as far as you can and then backing up to try another path is exactly the idea behind another core algorithm, Depth-First Search (DFS).
The Big Picture
A graph is a powerful structure that models tangled, many-to-many relationships and lets us answer real questions at scale. What we just did by hand — exploring level by level for the fewest hops, and walking-then-backtracking for the budget question — is a dry run of the two most common graph traversal algorithms, BFS and DFS. Later in the course you will learn how to store a graph in computer memory and how to write these algorithms properly.